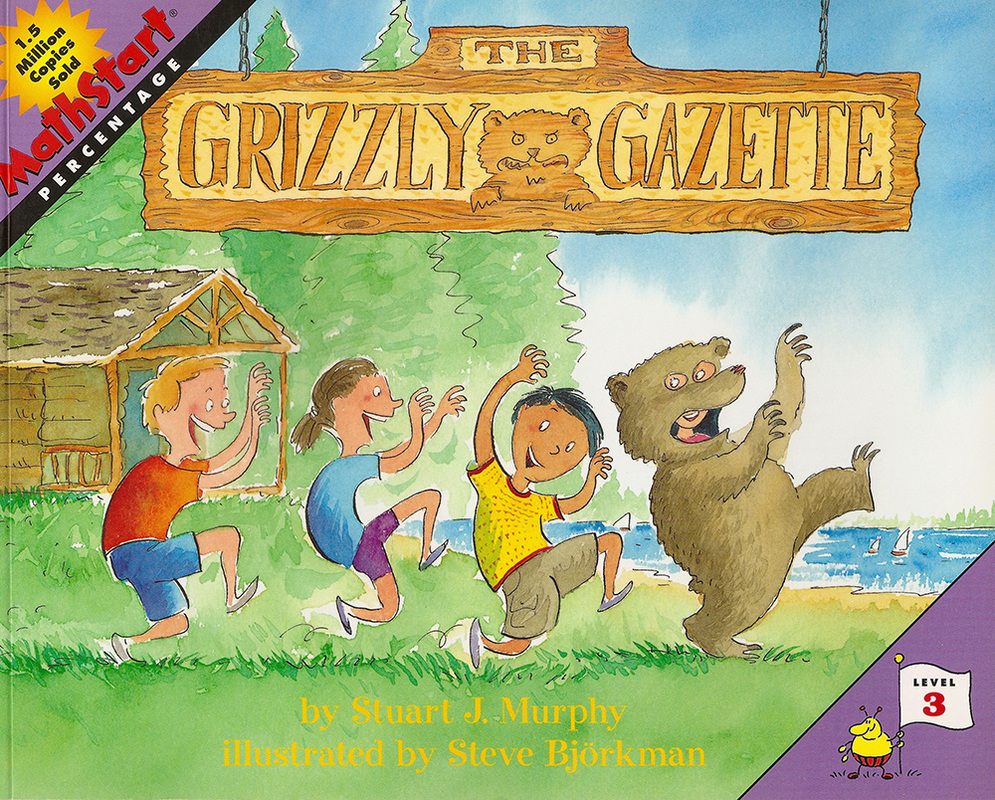
It's election time at Camp Grizzly. Who will win the race to be the new mascot? Sophie's got the support of the all-important boat club. Daniel hands out flyers and candy bars. But with 50 out of 100 campers—50%—still undecided, Corey decides to throw her hat in the ring. As the race heats up, The Grizzly Gazette publishes polls showing how the percentages break down using a pie graph. Can Corey catch up?
Learning how to describe a group of 100 in terms of percentages is the first step toward understanding this important concept.
Illustrated by Steve Björkman.
As you read the story, have your child (or students) find the sum of the percentages shown in each graph. It is important that children understand that percentages represented in a circle graph will always add up to 100.
Help your child (or students) draw a circle graph that shows one 50% segment and two 25% segments. Draw another circle graph that shows one 25% segment and one 75% segment. Talk about the language used to describe percentages. Equate 50% with one half of the circle, 25% with one quarter of the circle, and 75% with three quarters of the circle.
Cut a stick of butter or a candy bar in half. Then cut one half into two pieces. Ask your child (or students) to name the fractions (halves and quarters). Then ask which piece is 25% of the whole. Point out the largest piece and ask what percentage of the whole stick it is. Put 1/4 stick and 1/4 stick together and ask what fraction and percentage the two pieces combined represent.